Overview
Reports writer is a feature designed to allow users to create their own, customized reports. You can easily design a new report, save it, run it, and schedule its execution. Those reports can make use of any user-facing data in the CMMS, and allow you to present your maintenance data in a smart and elegant way.
How can I enable the Reports Writer?
The Fiix reports writer feature is available to all customers on the professional and enterprise plan. You can access the report writer page under the Reports main menu. If you do not have the reports writer, you can call +1 855 884 5619 ext. 1 to upgrade your plan.
Are there any Prerequisites?
The reports writer feature technically provides a visual interface to the MySQL language. It has been designed in a way that any user can learn how to use it fairly easily. However, it is an advanced feature, and as such, you will greatly benefit from previous experience in generating reports. This resource guide is to be used as a companion to the Champion Reporting and Master Reporting training courses. Our reports writer feature is quite similar to other reporting tools, and works in a similar fashion as them, such as Pivot Tables in Excel, or queries in MS Access. Of course, if you have a working knowledge of MySQL queries, this will feel like a walk in the park.
Database Tables
The database table is a collection of fields (can be thought of as columns) and records (can be thought of as rows). Each record holds a complete set of related data. Each record (row) in this table represents an asset record and all the related data associated with an asset. Each field (column) on the record makes up the individual items of that set. The record is constructed of many fields which each hold one piece of data making up a complete set.
Fiix uses a relational MySQL database. If unsure what a database looks like, think of an excel Excel book with tabs of data. In each tab we have columns and rows of data.
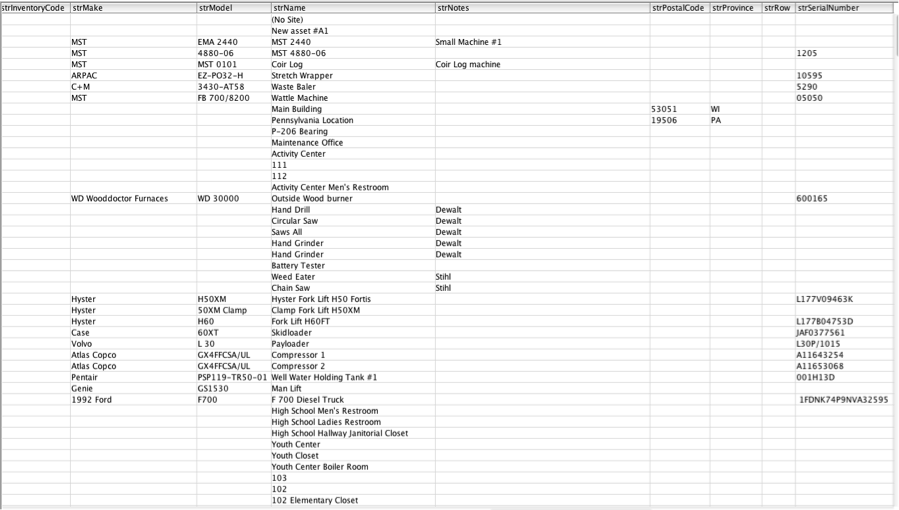
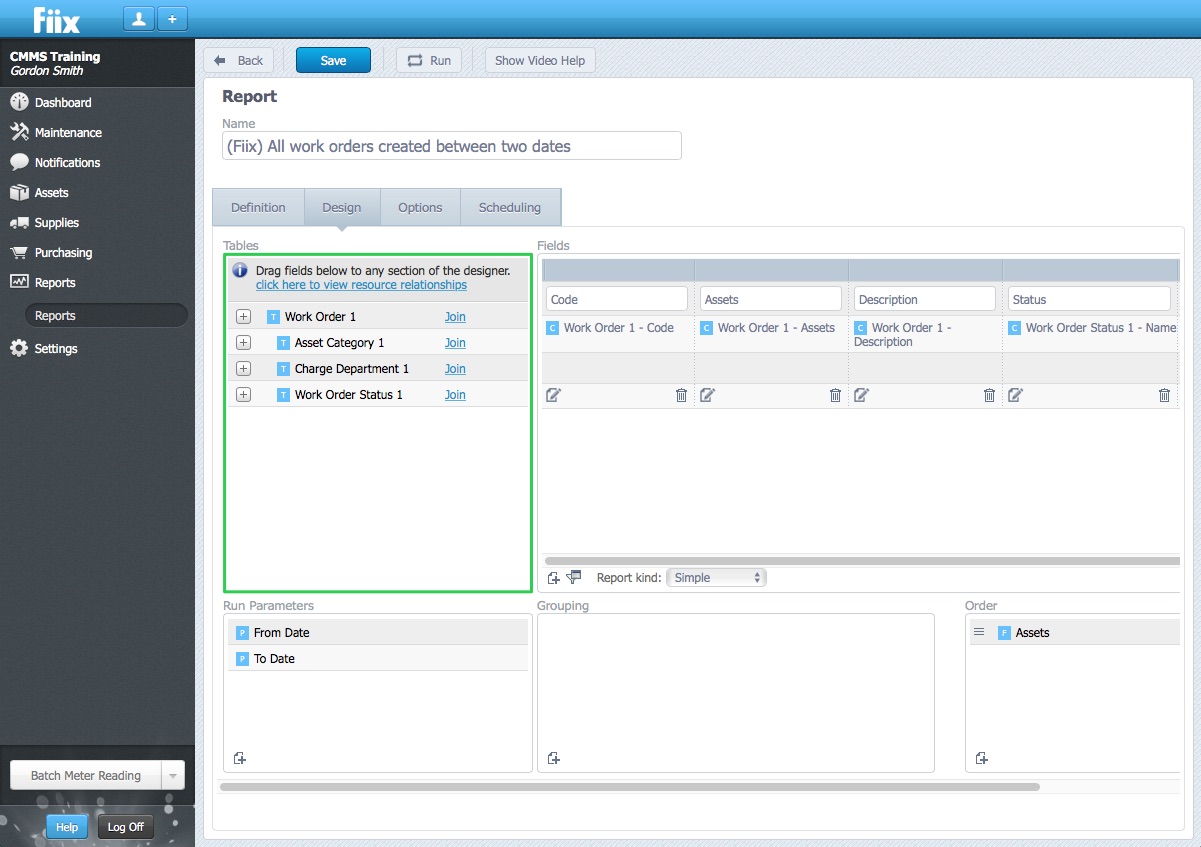
In this example, the asset table has been selected from the table options. An example of this concept is assets. When you select the asset table, you access a virtual table of data related to assets. Each asset has a name, description, code, make, model etc. The asset database table looks like the following:
We have simplified this by limiting the available columns to just what you need in the report writer. Simply expand out the table to view the available columns.
Master Database Table
In order to create a report, you must have at least one table from which the information for the report is being drawn from. This is called the master table. The report will be built around this. All other tables required in the report will be joined to this table.

The Query
Reporting is concerned with selecting and outputting a specific set of data to suit your interest. When you select data it is referred to as a query. A query is the question that is asked of all the available data. For example:
Select strName, strDescription, strCode
From tblAsset
Join Table 1
Join table 2
Where (Certain conditions)
Order by
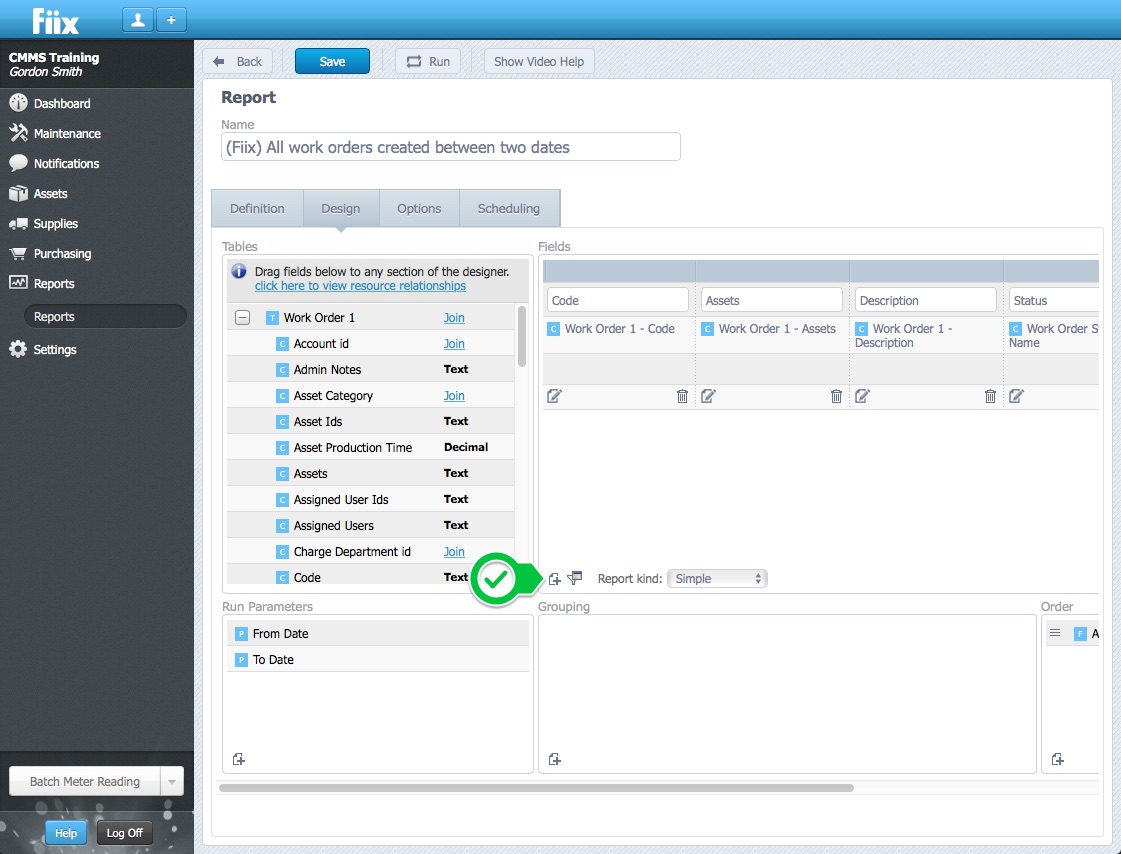
In this simple query, the asset name, description and code will be outputted for all assets in the database. The query narrows down and specifies exactly what data you are targeting. In the set up of the report using the report writer, you don’t need to know any code. You simply drag and drop the columns across to create your query and design your report. In addition, you control how you want the data to be displayed by dragging and dropping or resizing the columns.
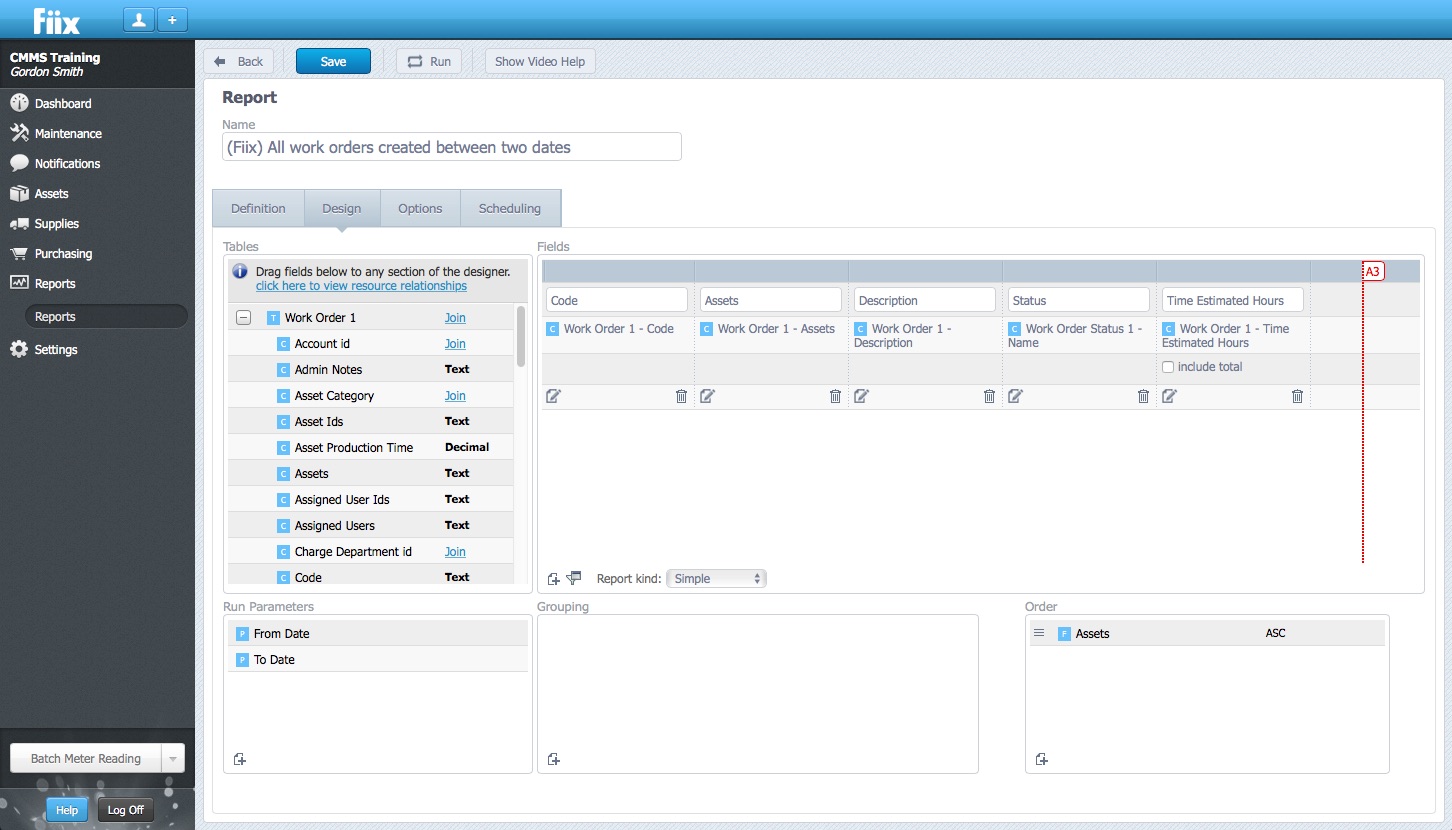
When you build a query you select which fields you wish to see from the selected table(s) for all the records that will be viewed. In the above example, the query will show the work order code, assigned assets, work order description, work order status, and the estimated work order time. When you run the query, only those fields will be placed into a smaller version of the table of data; that smaller table will be displayed on your screen. The order in which you view the selected fields can be modified later by dragging-and-dropping the fields to a new location. Resize the columns by placing the curser between the column headers and dragging left or right.
Custom Columns
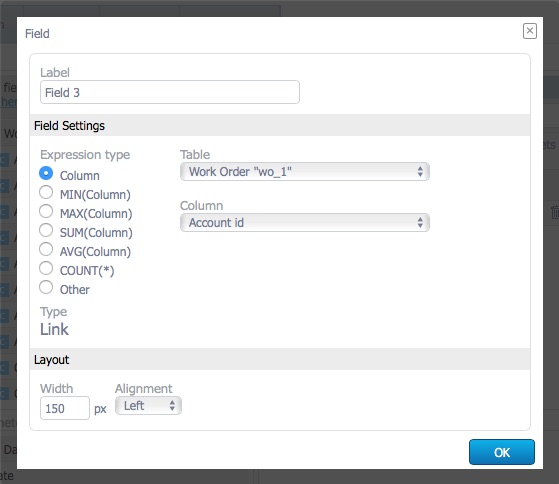
You can also add custom columns to the report. This is where MySQL experience comes in handy. Click the New button.
You can use some of the built in functions such as:
- SUM() - Will add the values in that group together (if numeric)
- AVG() - Will calculate an average of the grouped values (if numeric)
- MIN() - Will return the lowest value in alpha-numeric order
- MAX() - Will return the highest value in alpha-numeric order
- COUNT() - Will return the number of records that are grouped in that row
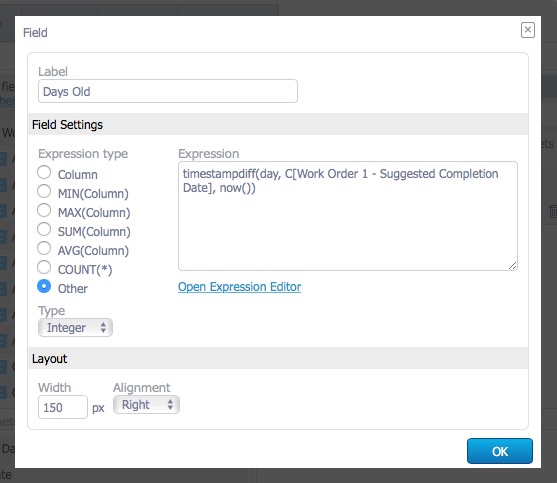
Alternatively, you can choose other and open the expression editor and build your own custom column using MySQL code. For example, lets say we want to see “days overdue” on an open work orders report. We need to create a column for Days Old that shows the difference in days between the suggested completion date of the work order, and the present time. The code looks like this:
timestampdiff(day, C[Work Order 1 - Suggested Completion Date], now())
The Join
Fiix employs a relational database so many tables are referenced in others. You will notice this in dropdown menus in various pages in the CMMS. For example, the asset category table lists a list of possible asset categories. You simply reference the asset category on the asset record. In the database, the asset table references the asset category table
If certain fields you need are not available in the main table, you can add supplementary tables to the report using a join. If you open out the asset table in the report writer, you can see quickly which fields are simple text fields, and which fields reference other tables.
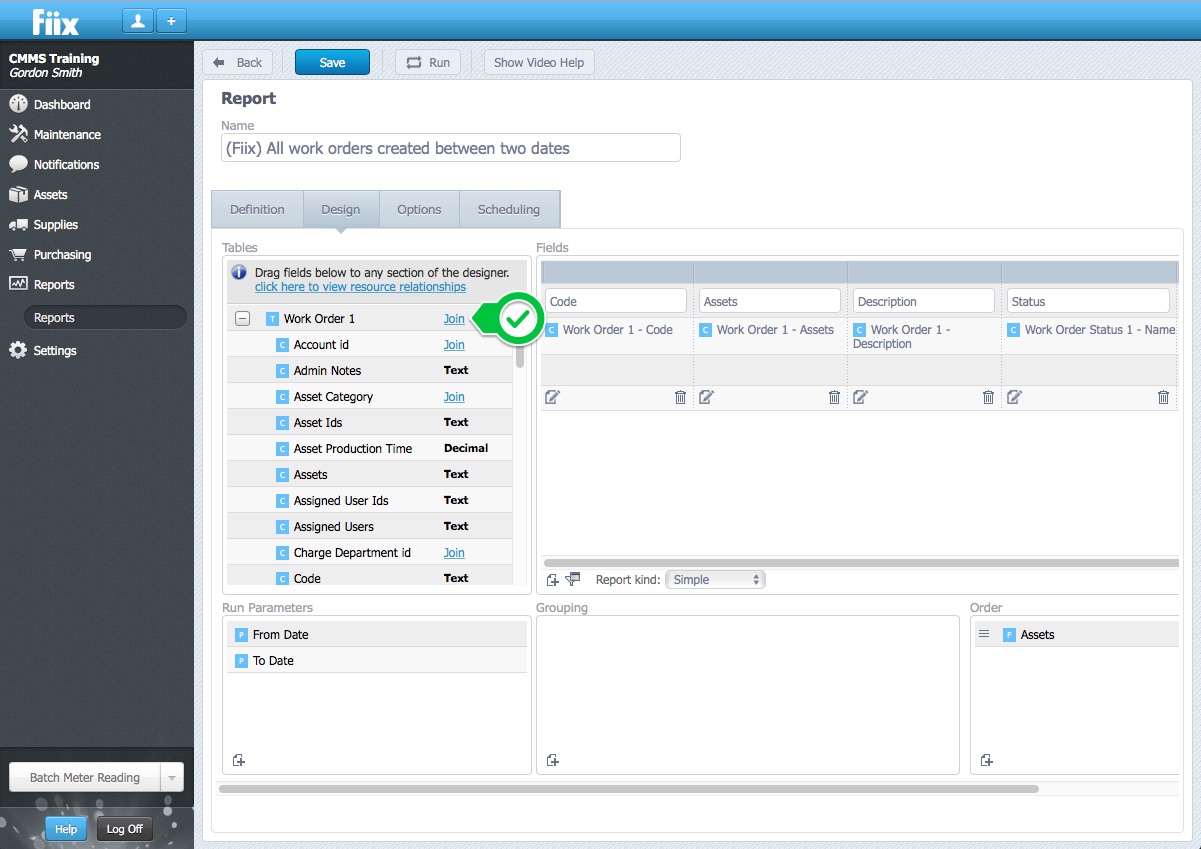
To add the data from another table in the database, you must join to that other table in some way. For example, if I want to add the asset category details in a column in my report, I need to join the Category ID in the asset table to the Asset Category table:
Inner Join
The INNER JOIN keyword selects all rows from both tables as long as there is a match between the columns in both tables. If you join with an inner join, the data will only show up in the report if it exists in the 2 tables.
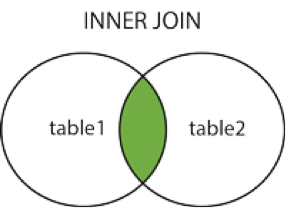
Example 1 - If you use INNER JOIN to join assets to the asset category table, and one particular asset does not have a category, it will not show up in the report.
Example 2 – If you inner join the work order table to the work order part table, only work orders with parts in them will show up in the report.
Left Outer Join
The LEFT OUTER JOIN keyword returns all rows from the left table (table1), with the matching rows in the right table (table2). The result is NULL in the right side when there is no match.
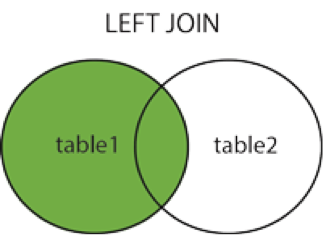
Example 1 - If you use LEFT OUTER JOIN to join assets to the asset category table, and one particular asset does not have a category, it will still show up in the report.
Example 2 – If you LEFT OUTER JOIN the work order table to the work order part table, all work orders, regardless if they have parts or not, will show up in the report.
Note:- Unless a record must have a certain condition to exist, then the left outer join will most likely be used.
Right Outer Join
The RIGHT OUTER JOIN keyword returns all rows from the right table (table2), with the matching rows in the left table (table1). The result is NULL in the left side when there is no match.
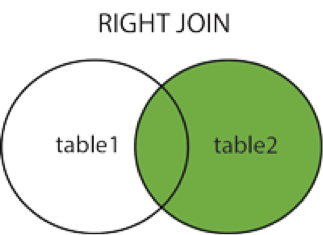
Example 1 – If you RIGHT OUTER JOIN the asset table to the work order table, all work orders regardless if they have an assigned asset or not will show up in the report.
Join Summary
- Inner Join: All of the records from both tables, that have a value in the field that was joined, will be included.
- Left Outer Join: All of the records in the first (left-hand) table are included even if there are no matches in the second (right-hand) table. This is the default join type.
- Right Outer Join: All of the records in the second (right-hand) table are included even if there are no matches in the first (left-hand) table.
Any join will show beneath the main table. Unlike the master table, joins can be added at any time and can also be removed from the report if you either chose the wrong table or no longer need its information. You can add multiple joined tables. Tables can be joined directly to the main table or joined to another table, which is joined to the main table. Click the + for the table to which you want to join another.
The Filter
Usually, when building a query, you are only interested in seeing a small portion of the records in a table. Filtering is the concept of allowing or disallowing certain records to be viewed. To filter, you specify what data must be contained in a field to allow the record into the query. The records that meet the filter conditions will be brought into the query (added to the smaller table).
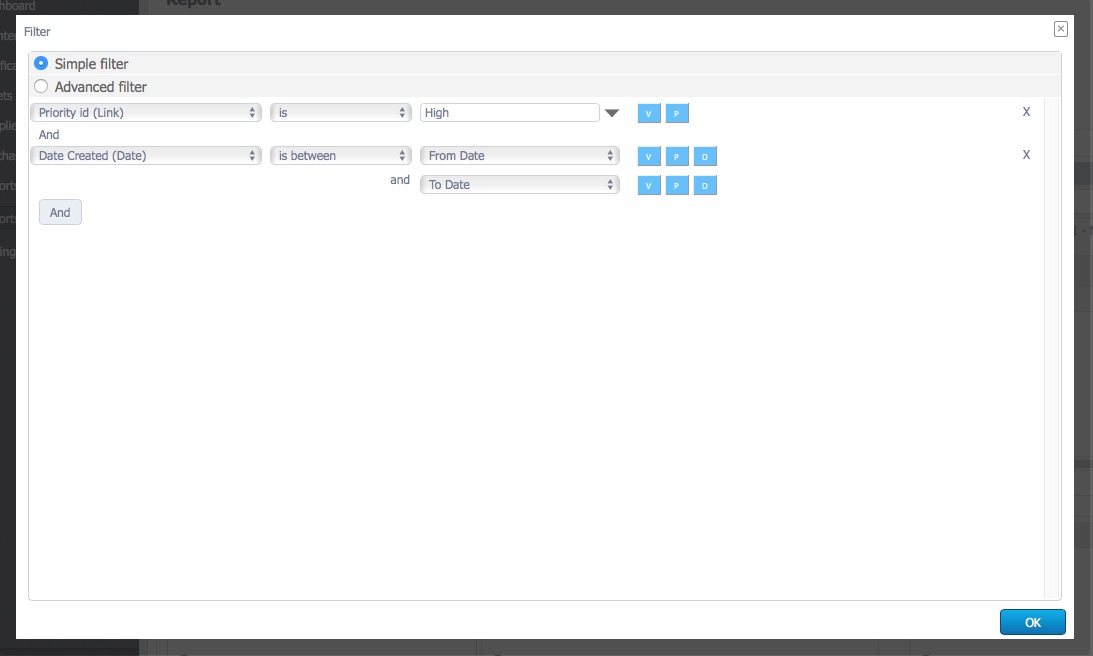
1. Simple Filter
Conditions determine the way in which filters interact with each other and the report as a whole. In order to create a simple filter it is important to understand the difference between the “AND” and the “OR” operators. These two operators are used to configure the CMMS Custom Filters:
- The “And” operator indicates that all specified conditions must be met.
- The “Or” operator indicates that any specified conditions can be met.
Note: Both the “AND” and “OR” operators cannot be used in the same simple filter. If you want to use AND and OR, you must use a complex filter.
To summarize, the “And” operator is restrictive and the “Or” operator is flexible. For example, if we want to create a work order report that only shows high priority open work orders, that were created between two dates, we need to create a filter:
2. Complex Filters
This is where MySQL experience comes in handy. You can use some of the built in functions such as:
- SUM() - Will add the values in that group together (if numeric)
- AVG() - Will calculate an average of the grouped values (if numeric)
- MIN() - Will return the lowest value in alpha-numeric order
- MAX() - Will return the highest value in alpha-numeric order
- COUNT() - Will return the number of records that are grouped in that row
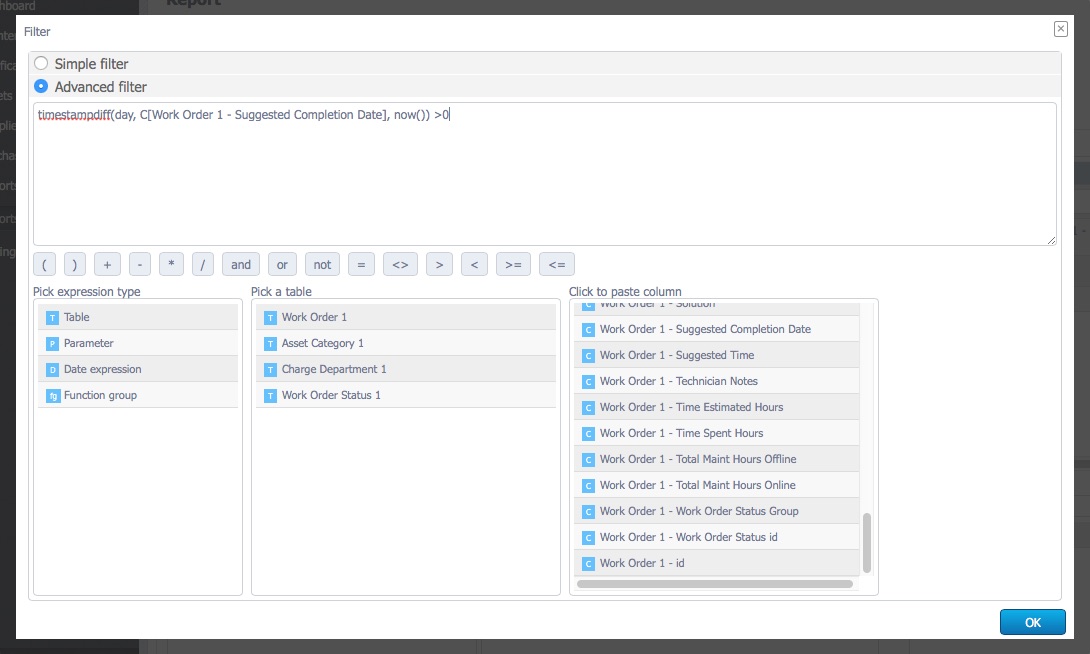
Alternatively, you can open the expression editor and use your own MySQL code to filter the data as needed. For example, lets say we only want to see overdue work orders in a report. We need to create a filter that only shows work orders where the difference in days between the suggested completion date of the work order, and the present time, is greater than zero. The code looks like this:
timestampdiff(day, C[Work Order 1 - Suggested Completion Date], now()) >0
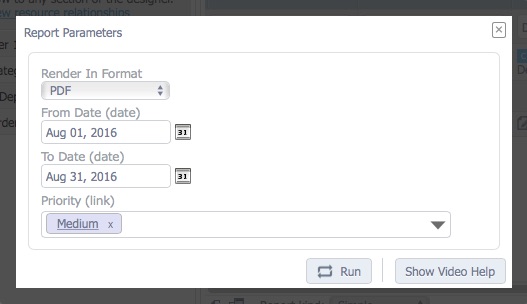
Report Parameters
In a report, parameters are used to enable the user to custom filter the data in the report each time the report is run. You'll notice them when just after you click to RUN a report. A popup window like the following shows up:
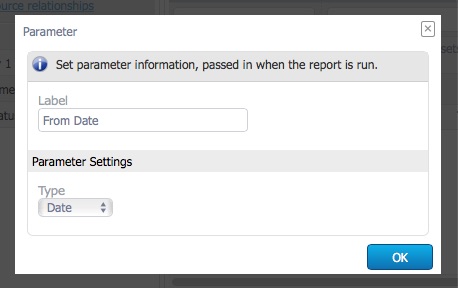
To add a parameter, click the New in the Run Parameters area.
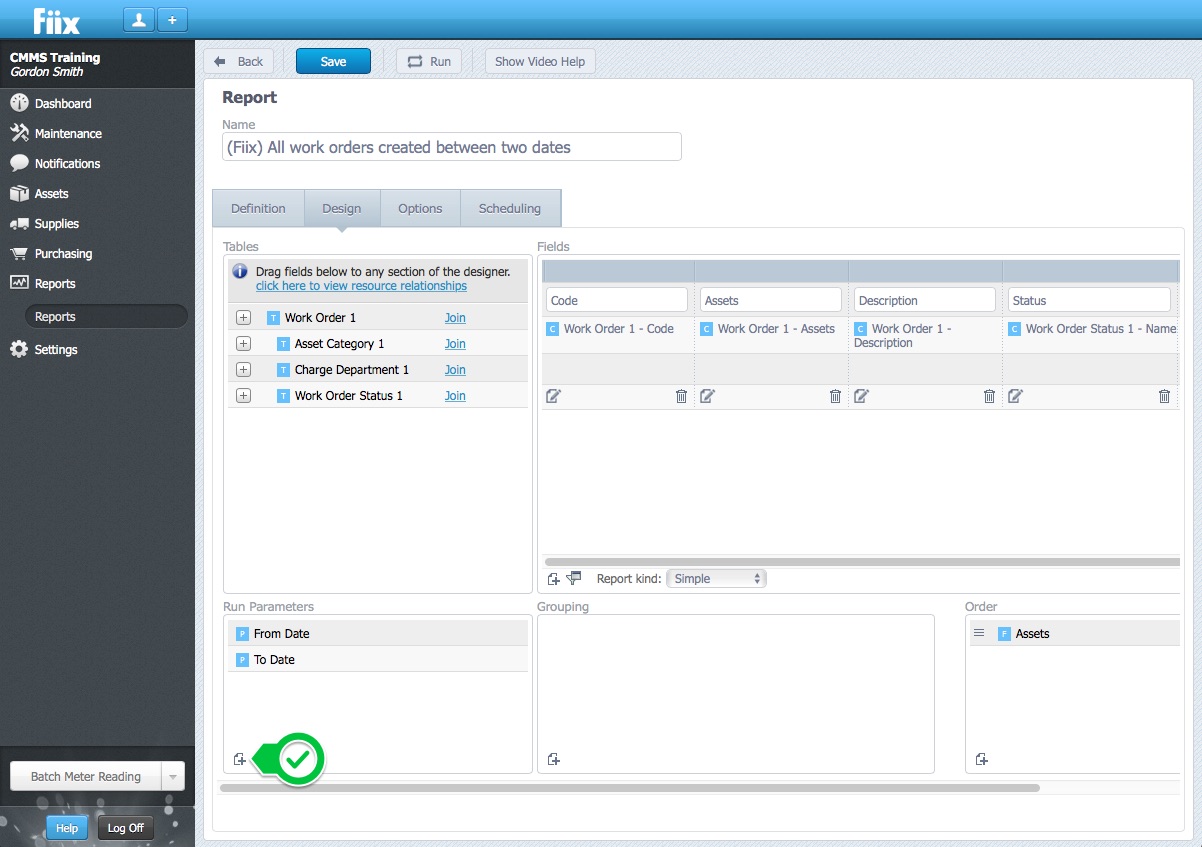
For example, lets say you want to run a work order report between two dates. You need to create two parameters for from date and to date. You can then customize your parameter for your needs. In this example, a “From Date” parameter has been created of “date” type. The type means the date input window will be presented to the user when running the report.
Once you have created your parameters, they won’t do anything unless you create conditions for the parameters in your report. To do this, you need to return to the filter section and create a filter for the parameters. The filter should refer to the value of the parameter at run time and change the data or appearance of the report. For the above example:
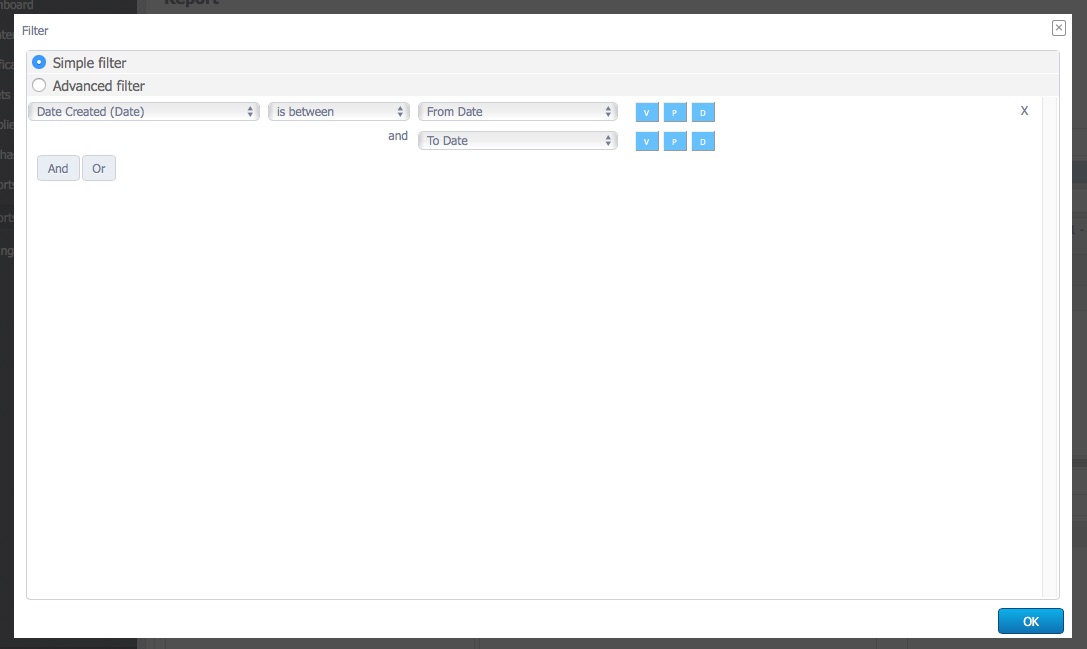
This filter will look for work orders that meet the two conditions inputted by the user:
- between the from and to dates set by the user
Group By
The GROUP BY statement is used in conjunction with the aggregate functions to group the result-set by one or more columns. The GROUP BY clause is used in collaboration with the SELECT statement to arrange identical data into groups. Ordinarily, the GROUP BY clause follows the WHERE clause in a SELECT statement and precedes the ORDER BY clause but in the Fiix reports writer; it has its own specific area.
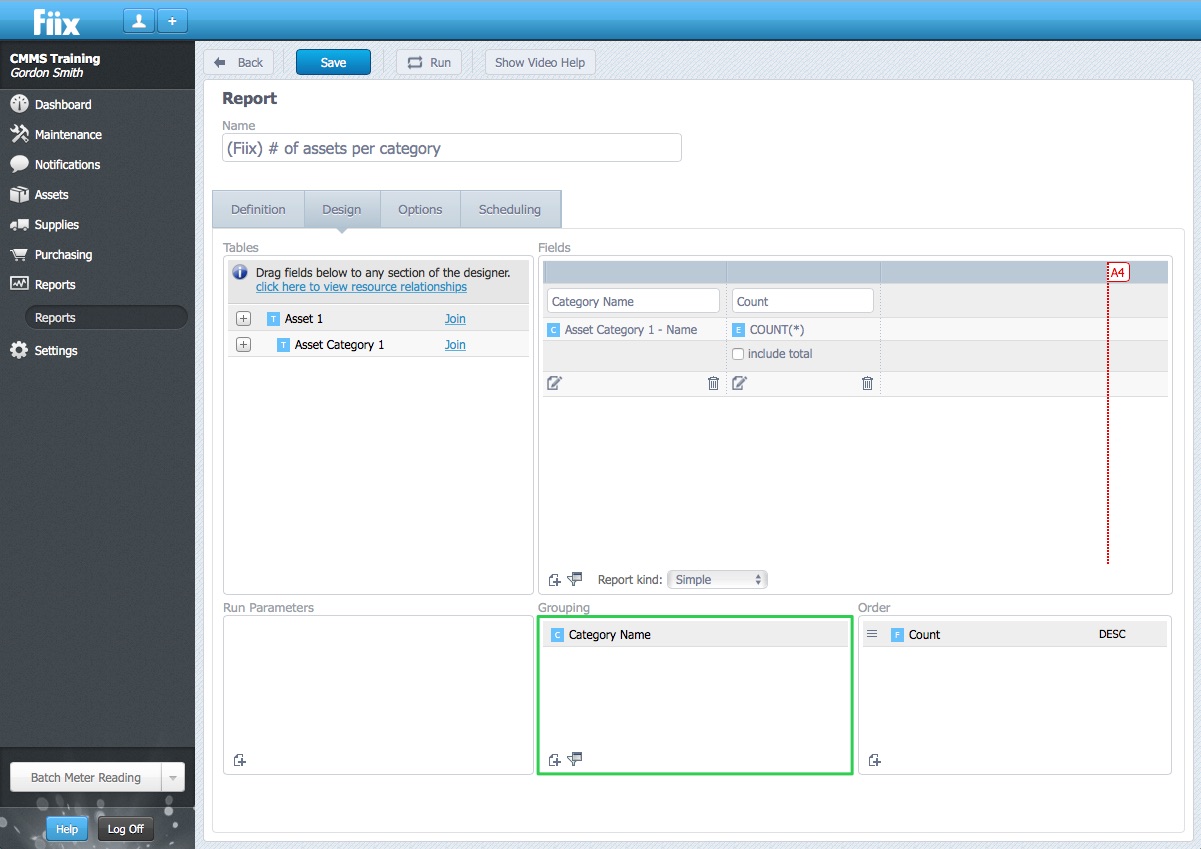
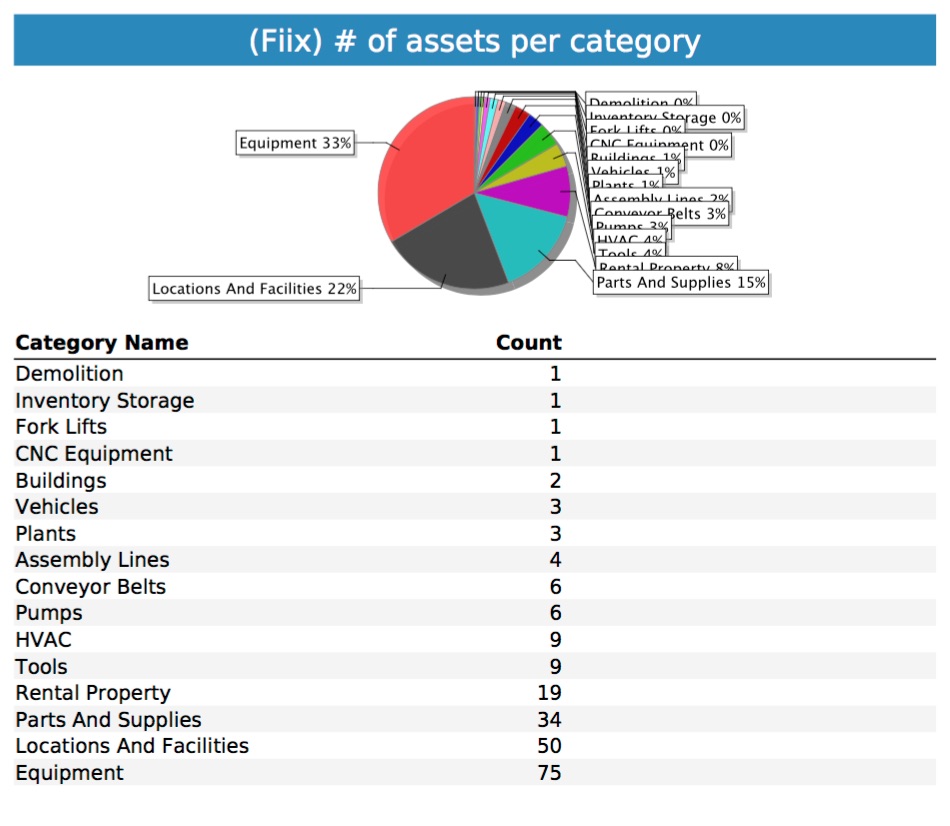
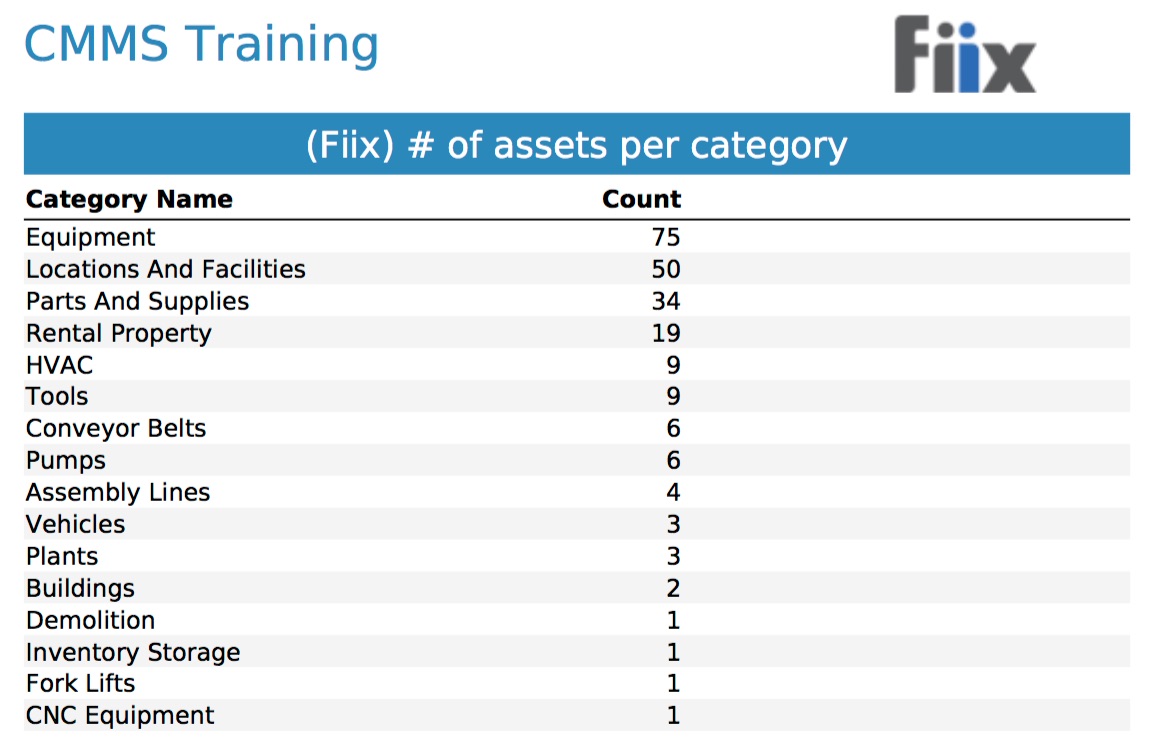
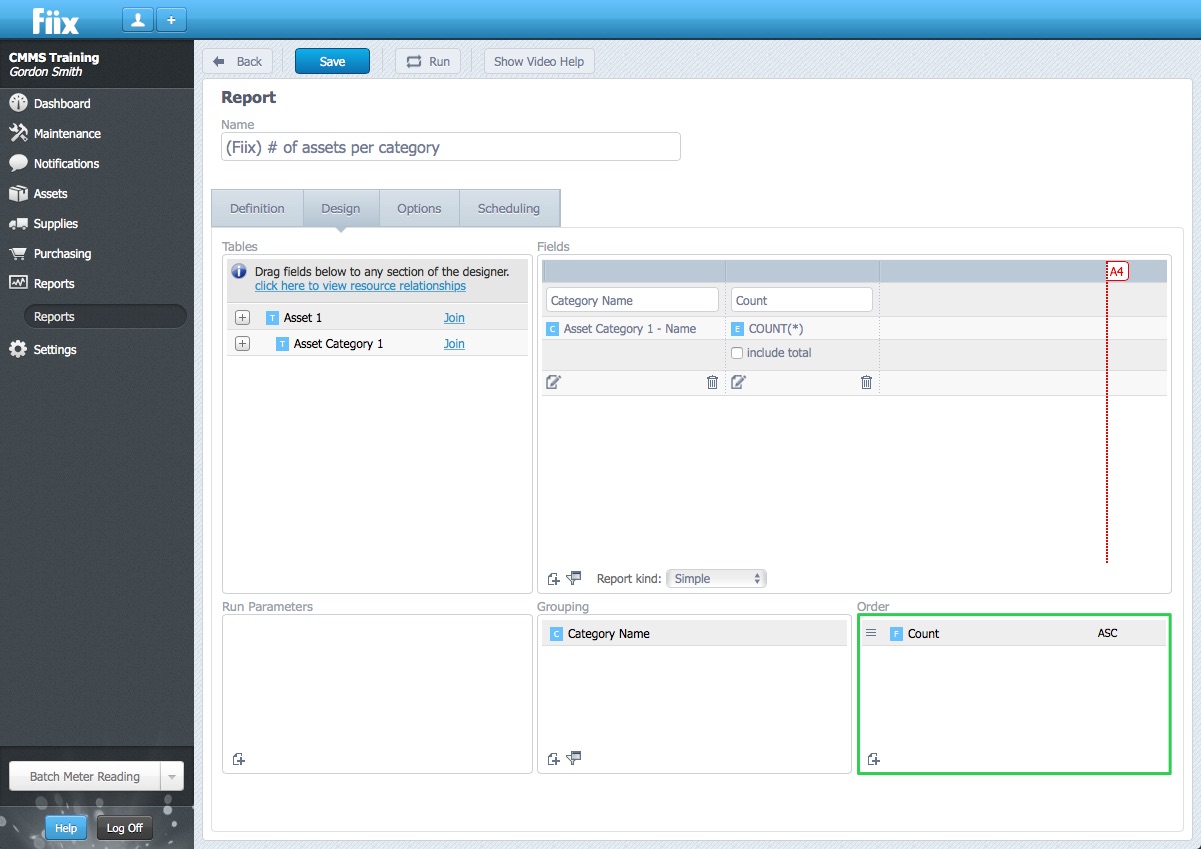
For example, if you want to count all the assets in a category, you first join the asset table to the asset category table. Add the count function as a column to simply count up the number of records in the database. Without the group by in place, it will just count the number of all assets in the database. With the group by in place, it will count up the number of records grouped by category.
Order By
The ORDER BY keyword sorts the records in ascending order by default. To sort the records in a descending order, you can use the DESC keyword. This is built in functionality in the Fiix reports writer so you don’t need to write the code. You can sort by any column or field, ascending or descending. In this example, the count column is sorted so the report orders the count of assets in each category in ascending order:
Master Detail Reports
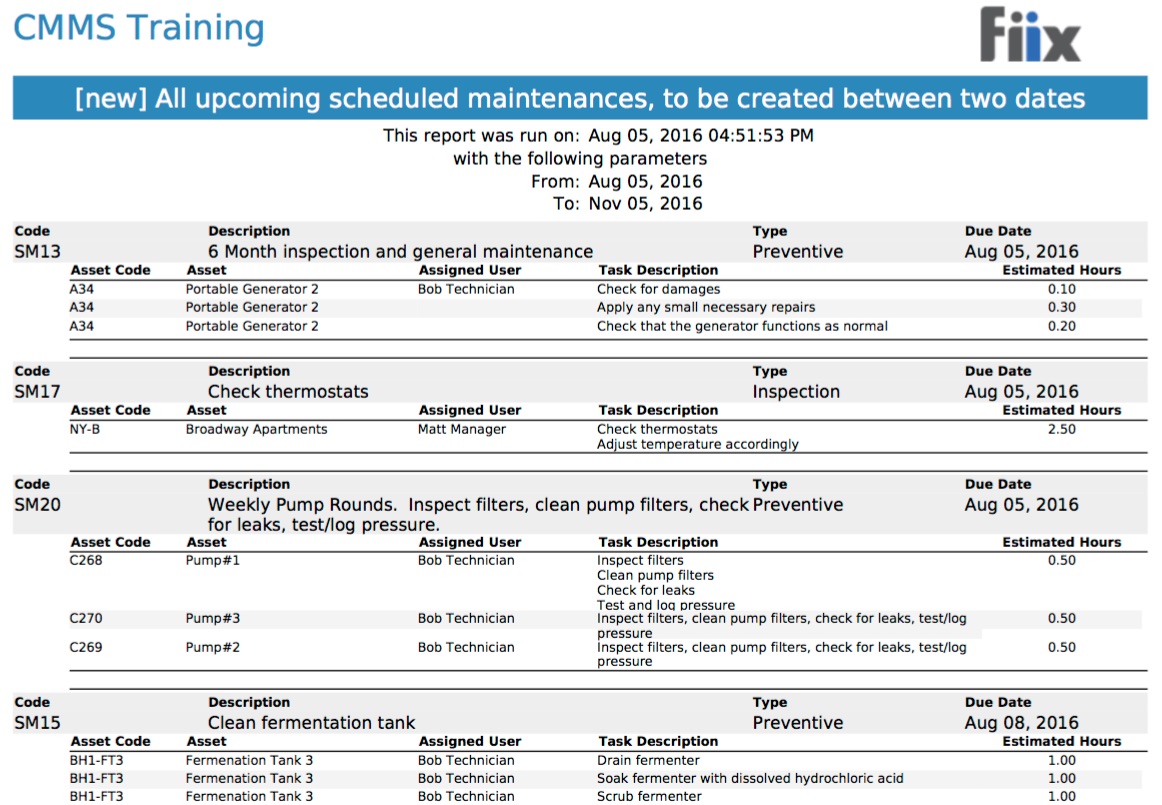
A report is usually called Master-Detail if it displays data from a hierarchical data source. When implementing a master-detail report, a list is used to display master rows. A subreport nested inside the List is used to display the detail rows. Contents of the List repeat for each row in the master. Since the subreport is contained in the List, the subreport is executed for each row in the master. The master row's primary key is passed to the subreport as a report parameter. The subreport examines the report parameter, and displays detail rows that match the supplied master primary key.
Building a Master Detail Report
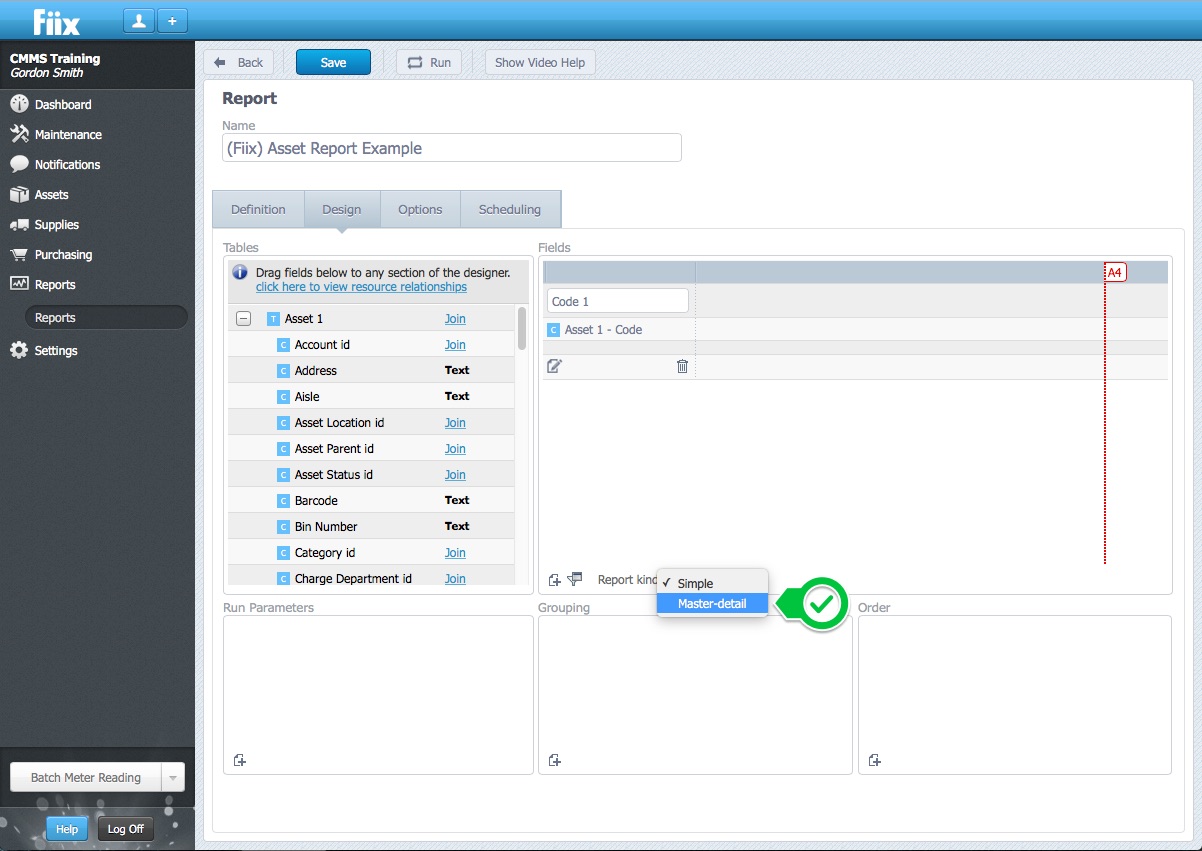
Master detail is useful when you want to show related information in the database in a sub section. For example, you may want to show the tasks or parts used on a work order. To create a master detail report, toggle the Report Kind dropdown menu to Master-Detail. You can then build out the master and detail sections separately.
See Create a Master Detail Report procedure for more information
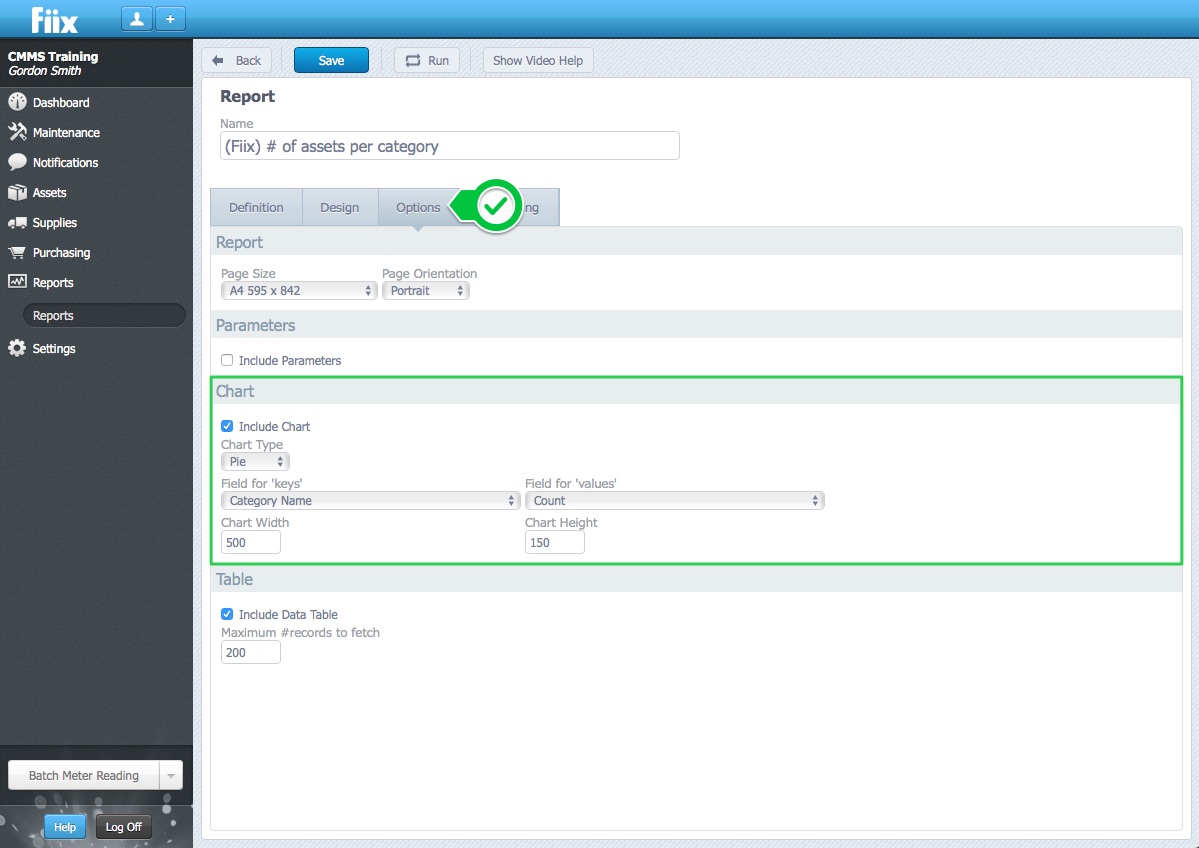
Graphical Reports
Reports can be configured to return results in a variety of different ways. Graphs are often used to show the data in a more visual format. This manual will take you through one simple example and explain how to create reports that display them as various types of graphs. Any report can be configured to display as a graph, but some configuration or adjustment may be needed. In the asset category example above, a chart was added to the report in the options tab of the report.
- Check the checkbox to include a chart
- Choose the chart type from the dropdown
- Assign the key and the value for the chart. The key is usually text; the values are usually numbers.
- Adjust the size of the chart if necessary
- Click run
The corresponding report looks like the following: