Overview
This procedure will show you how to create your first custom report from one of our report templates. To better explain this functionality, let’s run through the process with a specific example. Let’s create a report that shows us a list of all open work orders, as well as the assigned user and associated assets.
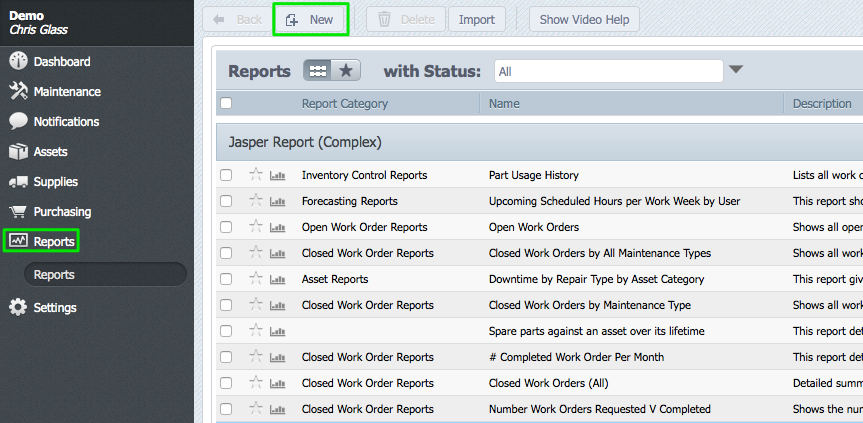
The process of creating a report is pretty simple. To begin, navigate to reports, and click the New button highlighted below.
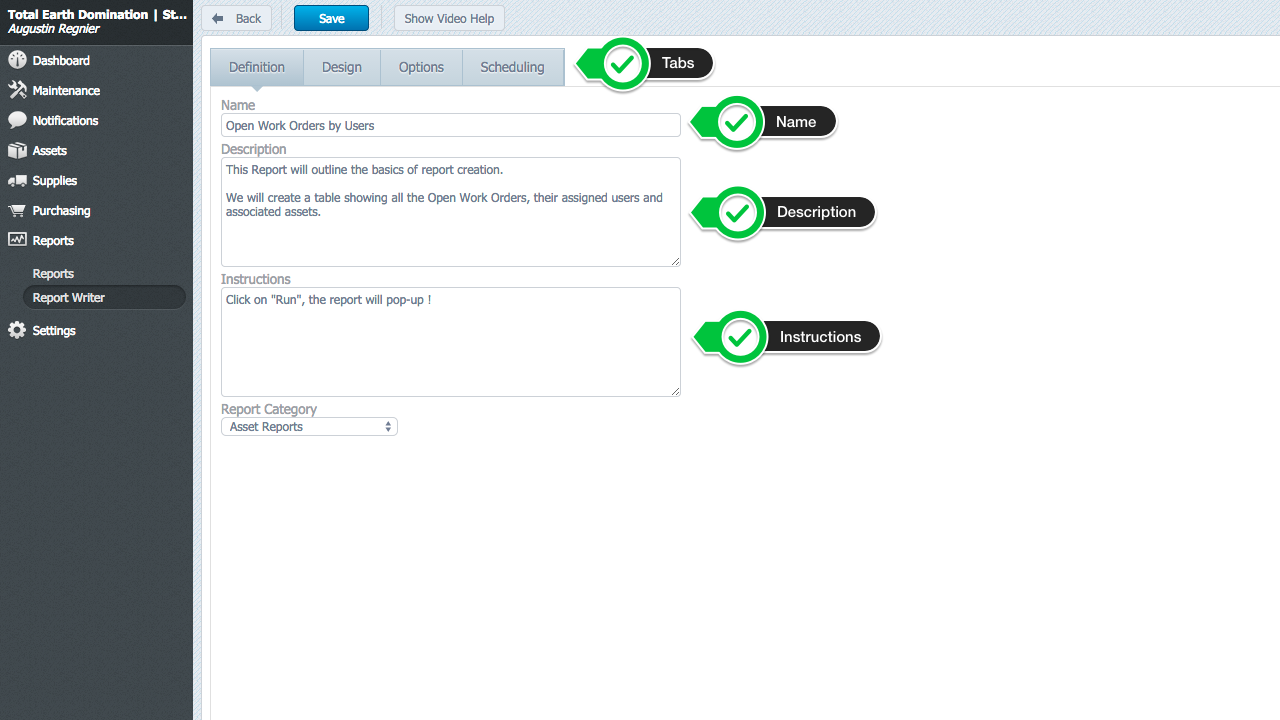
The custom report builder interface is divided into different tabs: definition, design, options, and scheduling. Here’s a quick explanation of what each one of these tabs controls.
- Definition: Basic information about the report
- Design: Select tables and organize them into columns
- Options: Customize things like page format, graph display, etc.
- Scheduling: Generate and send the report on a regular basis.
Definition
This is where you enter all of your basic information about the report. You can enter the report’s name, description, and instructions to run the report, as shown in the screenshot below. The report category drop down allows you to organize your reports into various pre-built categories.
Design
When you first select the design tab, you will see this screen:
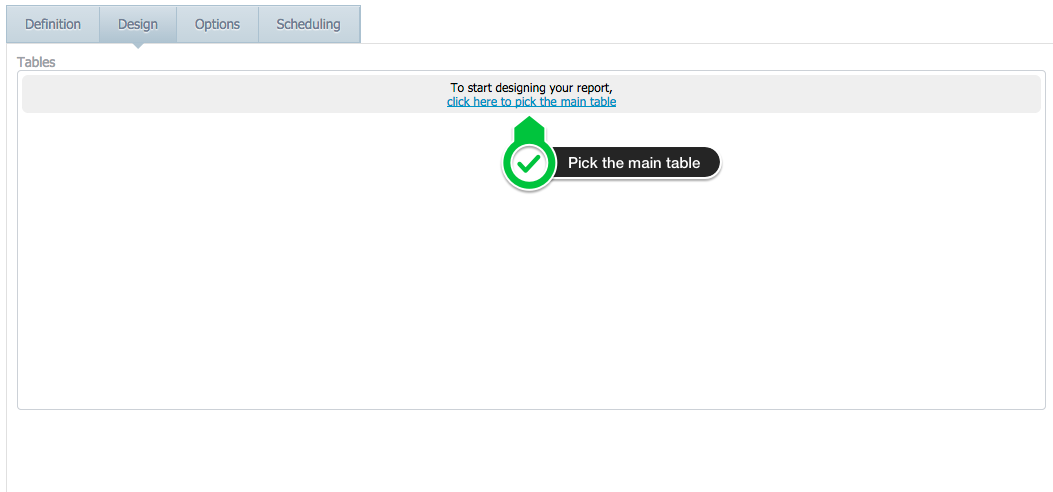
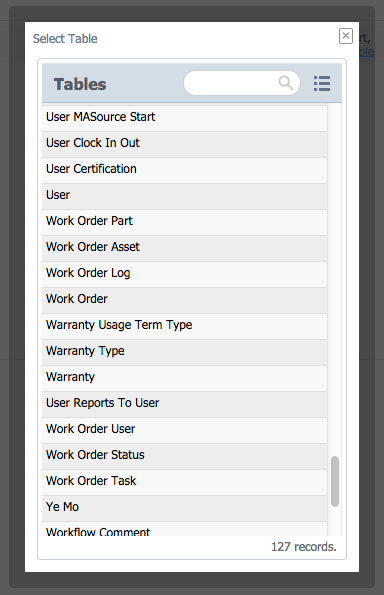
You need to pick your first table, to run reports against.
If you’re wondering which table to select, as a general rule you should start by picking the table that has the most data. In our case, let’s select the “work orders” table. This table contains most of the information needed to display our work orders.
Overview of the interface
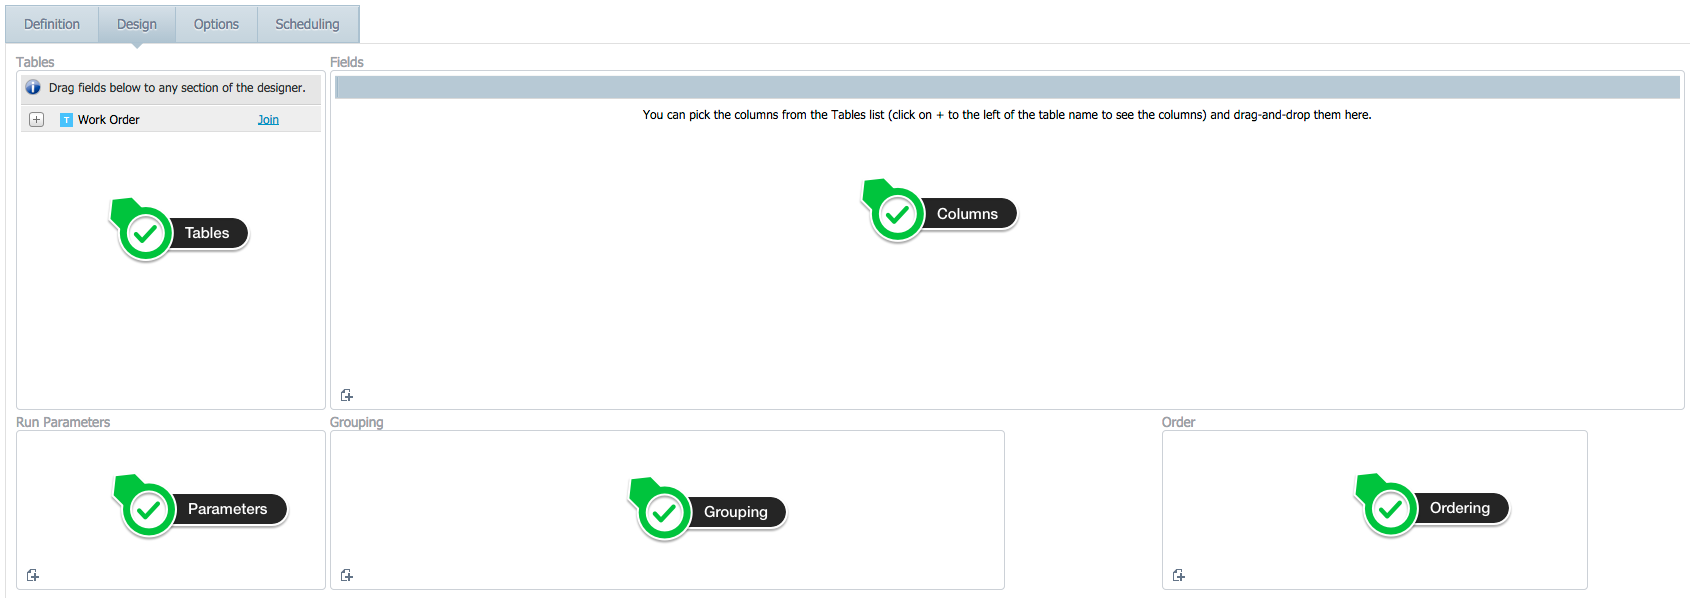
Let’s review some of the options that are available to you.
The “Tables” section lets you pick additional tables, joining them with the initial table you selected. This process is fairly advanced, so we will go more in depth in a different support article. To expand a table, click the little “+” icon next to its name. This will allow you to see all the available fields in that table.
You can also add fields to your report by dragging and dropping them from the “Tables” section to the “Fields” Section. The “Fields” section is where you will be able to display your report’s fields, as well as filter your report data.
The “Grouping” function lets you group your results into different categories and is best used with the “Count” field. For example, you could count the total number of work orders assigned to a specific user, or the number of work orders with a specific status.
Finally, “Order” allows you to sort your data.
Building the report
A report is basically a breakdown of your data into meaningful sets of rows and columns that you define yourself.
Here, all rows will be work orders, but we need to add the columns fields first, to populate this data.
Expand the “Work orders” table, by clicking on the “+” icon next to the table name. This will show you all available fields for that table.
Let’s start by adding the Description, Work Order ID, and Asset to the report. This will generate a list of all our work orders.
Drag and drop the “Code”, “Description” and “Assets” from the “Tables” to the “Fields”.
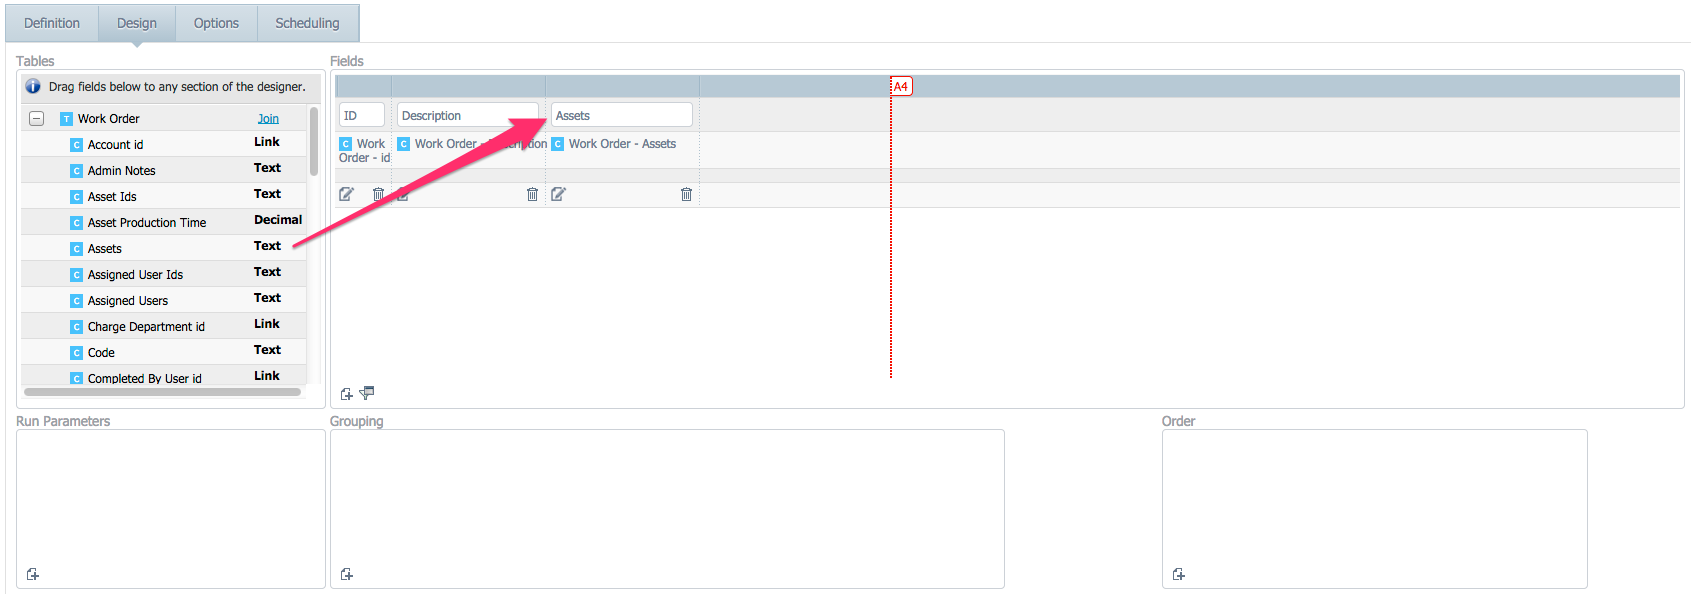
Now, let’s narrow down the report. Right now we see all work orders, regardless of whether they are open or closed, so let’s filter the report and only include open work orders.
Click on the small “Filter” icon. You should see a window that lets you set some more filtering options. For this example we’ll keep things simple. Select the “Work Order Status id”, “is not”, and pick “closed, completed” in the last dropdown.
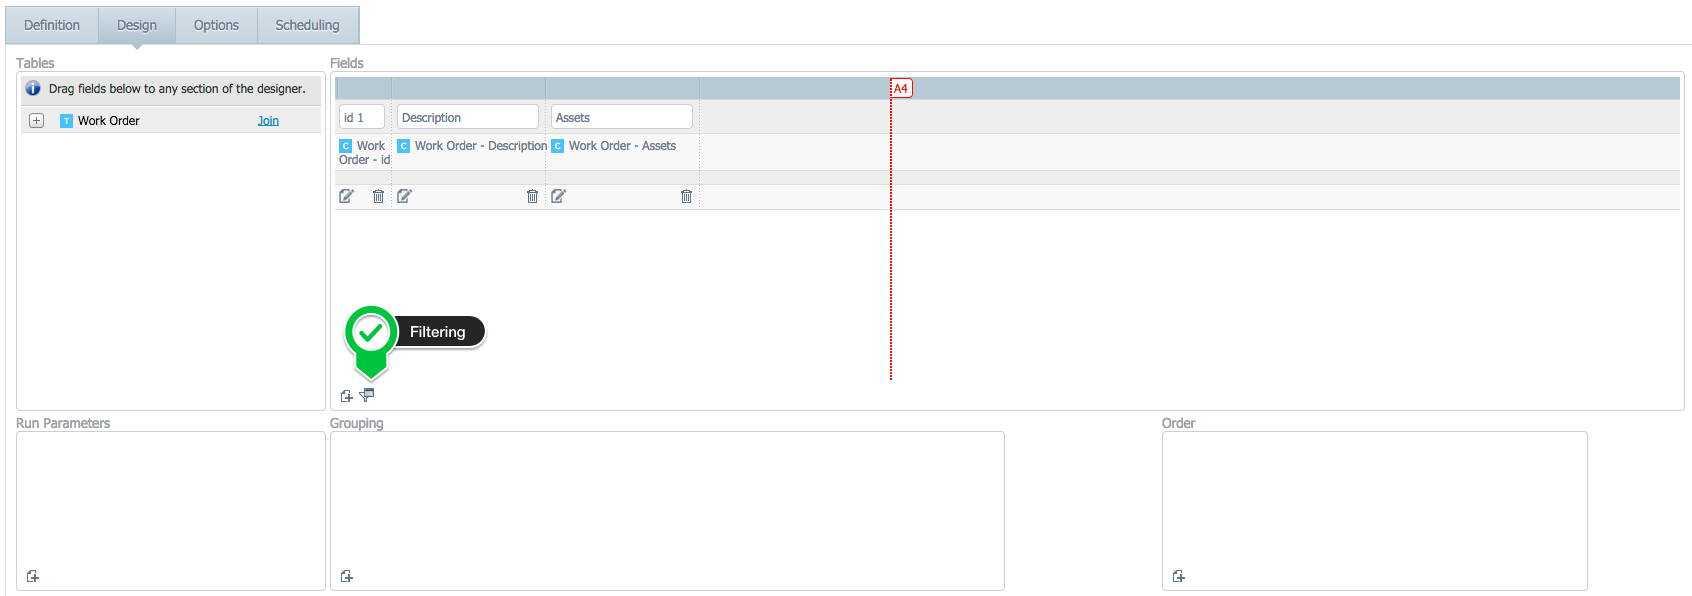
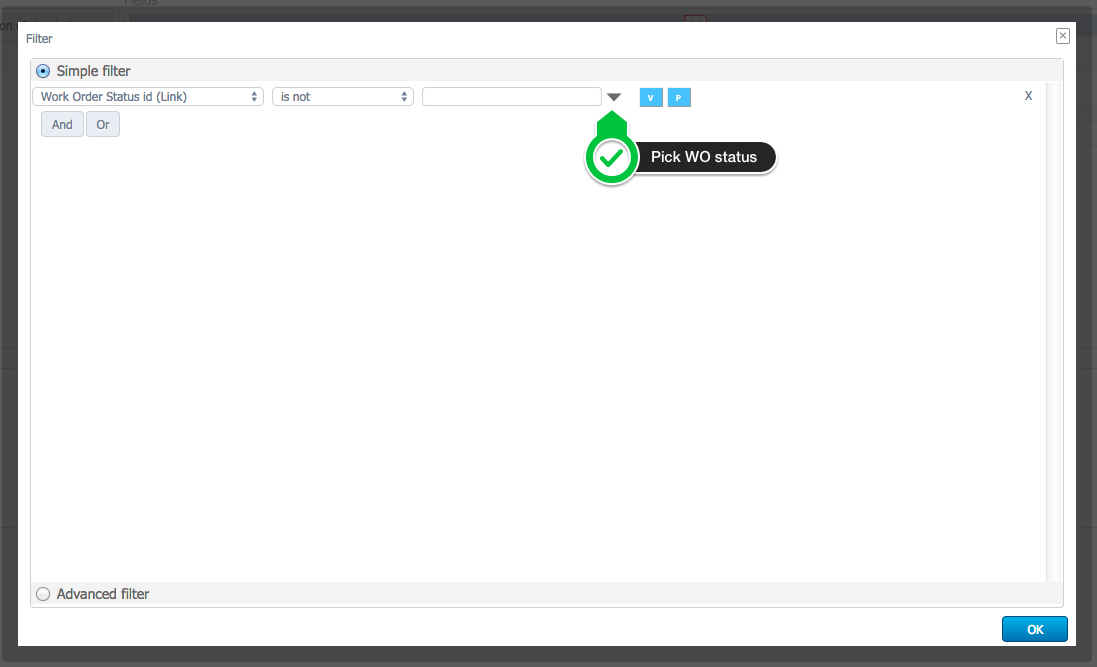
Now select OK. You now have a list of all your work orders, except those that are “closed, complete”
Finally, let’s add the assigned user to the report. Drag and drop the user to the Fields. Your report is now complete, just click Run, and your report will automatically show up.
Options
The “Options” tab lets you define custom options. You can leave everything as is by default for this report. However, for future reports you can easily add a chart, or change formatting options.
Scheduling
The scheduling tab works in the same way as the previous reports. To schedule a report, simply click on the new button, select a user and a frequency, and the report will be sent.