Overview
A Master-Detail report is used to display data from a hierarchical data source. When building a master-detail report, lists are used to display detailed subreports within master rows. Contents of the list repeat for each row in the master. The easiest way to see this in action is to take a look at a master detail report. The Master section is greyed out.
Since the subreport is contained in the master list, the subreport is executed for each row in the master. The master row's primary key is passed to the subreport as a report parameter. The subreport examines the report parameter, and displays detail rows that match the supplied master primary key.
Create a Master-Detail Report
Let’s say we want to build a custom report that shows a list of assets in the master section, and the corresponding scheduled maintenance actions for the asset in the details section.
1. To create a new report, click Reports, and New

The Report Writer interface is divided into different tabs : Definition, Design, Options, Scheduling
-
Definition just carries basic information about the report
-
Design is where you will actually design the report, select tables, and organize it into columns.
-
Options provides customization, like page format, graph display, etc.
-
Scheduling lets you generate and send the report on a regular basis.
2. In the Definition Tab, enter all your basic information about the report. Enter the report Name, Description, Instructions to run the report (this report does not need any specific parameters so we do not have a lot to put here). The Report Category lets you organize your reports into various pre-built categories.

3. Navigate to the Design Tab. In order to create a report, you must have at least one table from which the information for the report is being drawn from. This is called the master table. Select click here to pick the main table to add the master table.

4. In the next step, you need to decide a master database table to build this report around. The CMMS database has over 100 hundred tables from which to choose from. In this case, its an asset + scheduled maintenance report, so we'll select the Asset table from the list:
(The CMMS uses a relational MySQL Database. If unsure what a database looks like, think of an excel Excel book which tabs and tabs of data)

5. In the Design tab, expand out the Master table by clicking on the + icon. This show you all available fields for that database table.

6. The Fields section is where you will be able to display your report’s fields, as well as filter your report data depending on certain fields. In the set up of the report using the report writer, you don’t need to know any code. You simply drag-and-drop the columns across to create your query and design your report.
Drag one field over and you'll notice the Report Kind dropdown appears in the field window:

7. Toggle to Master-Detail report kind:

8. When you select Master Detail, the Band option appears. This determines whether the fields we drag and drop into the field window will be in the master or detail section of the report.

9. Select Master Header and start dragging over the Asset fields you wish to see in the report into the field window. Rename the column headers by selecting, and editing the headers. Click Save to save your work.

10. Resize the columns to fit within the report page margins. The report will not run if the columns are outside of the page margins.

11. Switch to the Detail band. You'll notice the fields will be blank in this section.

12. Before we can add any scheduled maintenance fields to the report, we need to Join to the scheduled maintenance table. If certain fields you need are not available in the main table, you can add supplementary tables to the report using a join.
(The different Joins are explained in depth in "What does Join mean when building a Custom Report?" procedure).
13. Click the blue Join hyperlink beside the Asset:

14. As you can have multiple assets on a single work order, and scheduled maintenance, before you can join to the scheduled maintenance table, you need to join to the scheduled maintenance asset table:

15. In this case, we only want to show assets that have scheduled maintenance so we use an Inner join.

16. Repeat the Join process for the scheduled maintenance table. Click Join to the scheduled maintenance asset table:

17. Select the Scheduled Maintenance table from the options. Again, we can do an Inner join so we only show assets with scheduled maintenance:

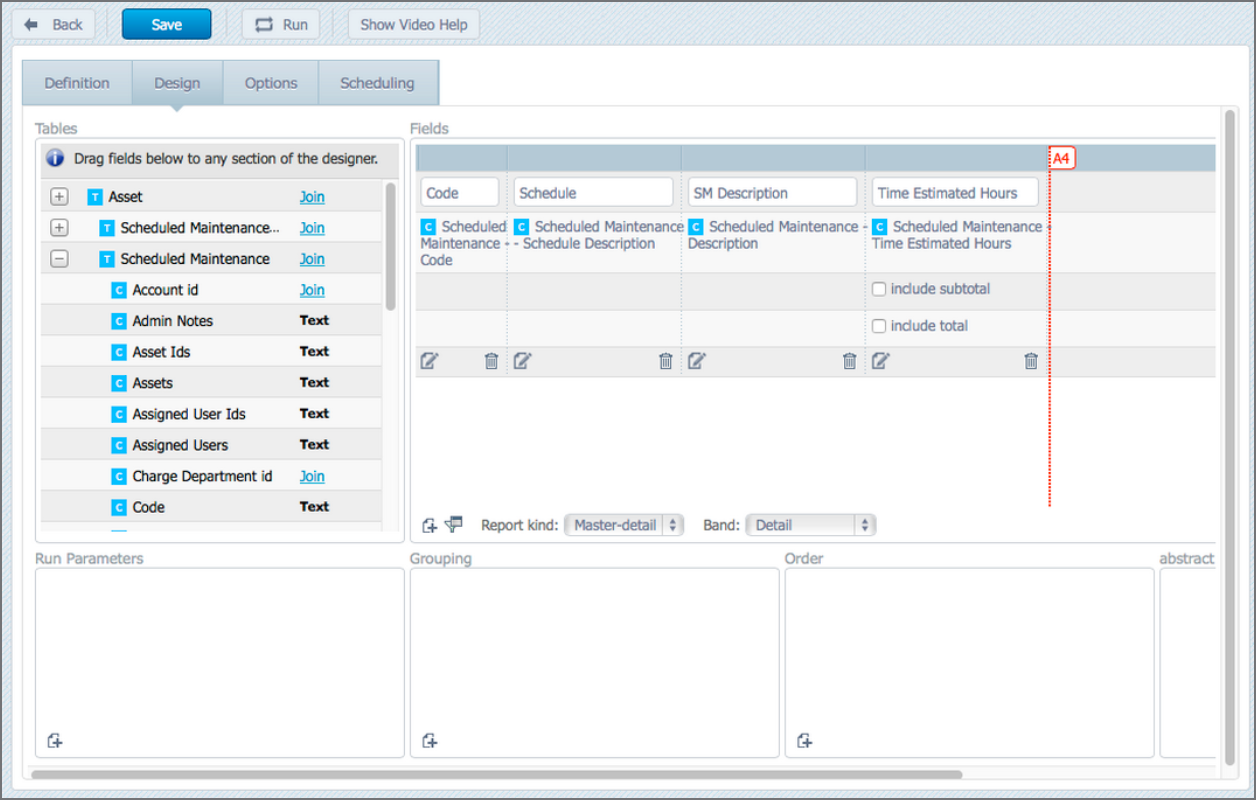
18. Open out the scheduled maintenance table and start dragging the columns over into the field window as you need them:

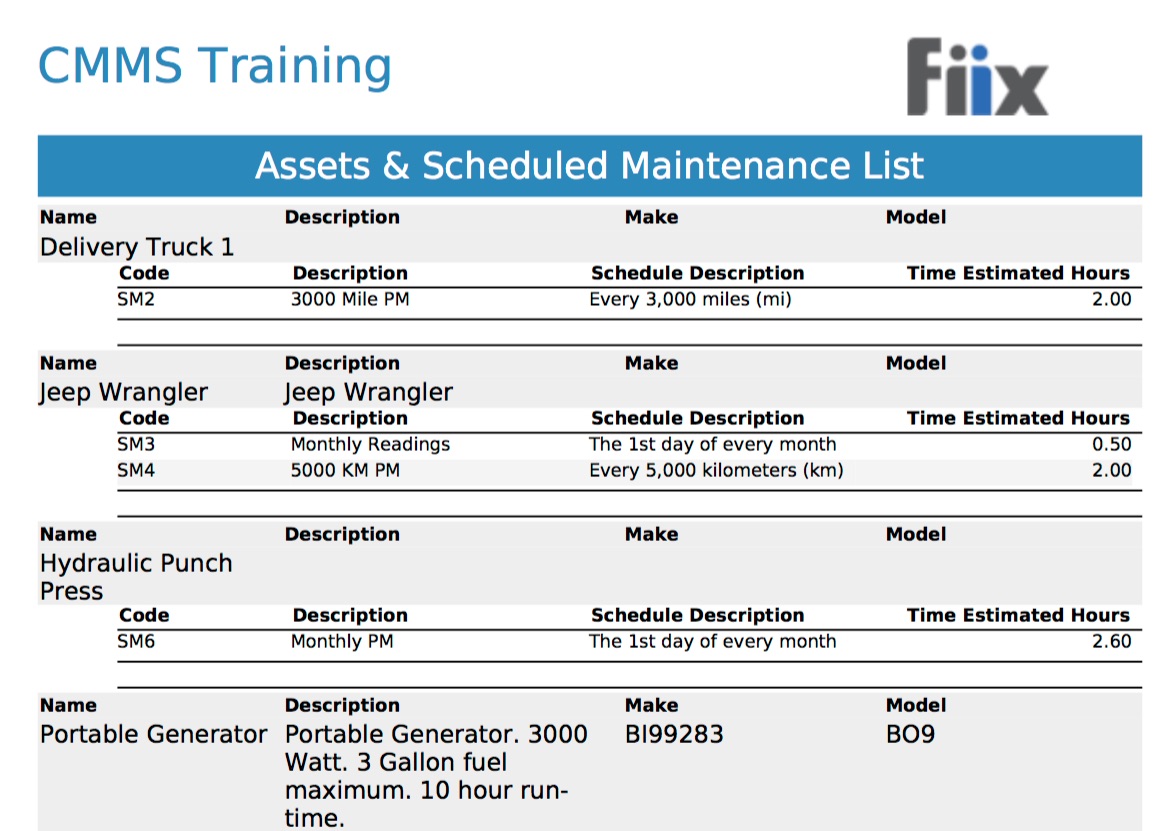
After dragging-and-dropping, and renaming the fields that you need, your report should look something like this:
19. Click Run to test. In the grey section, which is our master header, we have the asset info. The scheduled maintenance information is in the detail section.
20. Add custom columns, filters, ordering or parameters to customize the report further where needed.