Mean time between failures (MTBF) is the average number of hours between an asset’s failures. A higher MTBF means that your asset is failing less frequently, and is therefore more reliable.
MTBF is calculated by dividing the total number of hours in a given period by the number of times the asset failed during that same period. For example, if an asset fails twice over 700 hours, its MTBF for that period would be 350 hours (700/2).
This article will help you understand how to use MTBF, as well as how to track it using Fiix.
Tracking MTBF can help guide maintenance decisions that will result in improved asset reliability.
There isn’t a “magic number” when it comes to MTBF; instead, you should aim to improve it over time by optimizing your scheduled maintenance:
-
If MTBF is declining, it’s possible that your maintenance schedule is not aggressive enough. Try increasing the frequency of maintenance—especially inspections, so that you can address minor issues sooner.
-
If MTBF is improving, your current maintenance schedule for that asset is effective.
-
If MTBF is staying the same, you'll need to determine whether that value is acceptable to you. For example, you might decide to continue improving MTBF until it matches your longest scheduled maintenance interval. If the static MTBF is below the level you've deemed acceptable, you would continue refining your schedule until you reach that number.
Once MTBF remains static at a value that works for you, you might be able to optimize resources by backing off on your maintenance schedule (so long as you’re still complying with your SOPs, best practices, and any statutory requirements).
Now that we know why we need to track MTBF… how do we do it?
There are 3 key parts to tracking MTBF in Fiix:
Keep reading to learn more, or use the links above to jump to a specific section in this article.
Tracking asset downtime
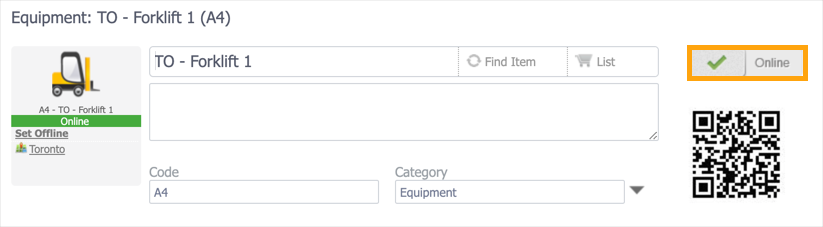
The most important factor to getting an accurate MTBF in Fiix is tracking asset downtime correctly. To do this, make sure that you always update your asset’s status when you take it offline (i.e. mark it as unavailable for use) or bring it back online (i.e. mark is as available for use).
To change an asset’s status, use the toggle at the top of the asset’s record:
When you switch the toggle, you’ll be prompted to select a reason for changing the status:
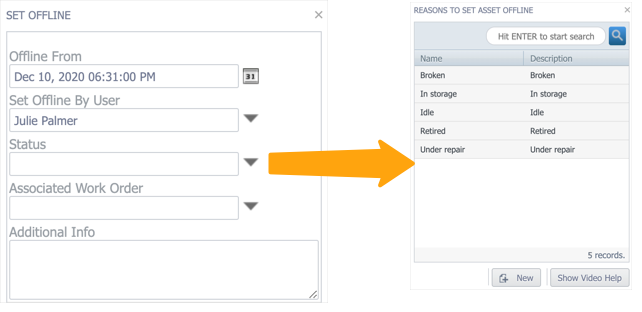
Selecting the appropriate reason lets you specify exactly why you’re changing the asset’s status. This is especially important when taking an asset offline, as selecting the correct status helps you (and Fiix) identify whether the asset was taken offline for planned maintenance or because of a failure.
Tip
If you need to track additional reasons (i.e. reasons other than the default ones we provide), you can add your own by clicking the New button at the bottom of the list, and entering a name and description for the status.
To learn more, see Downtime tracker.
Recording failure codes on work orders
Recording failure codes on your work orders gives you more insight into why your assets are failing, which can help you understand what changes might result in an increased MTBF. For example, you might notice the same failure on all your equipment that uses a particular type of bearing. By switching to a different bearing, you might be able to prevent a number of future failures, thereby increasing MTBF, improving asset reliability, and freeing up resources.
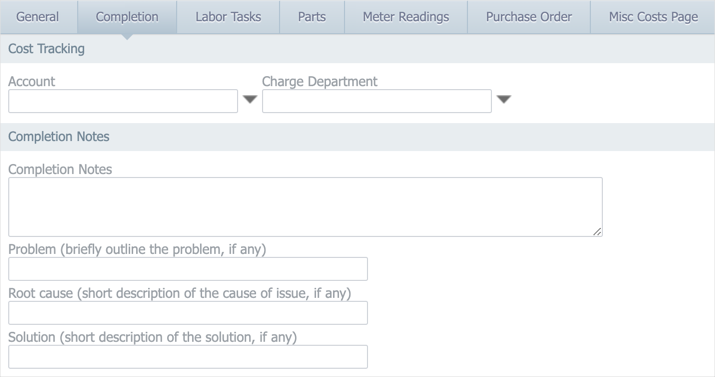
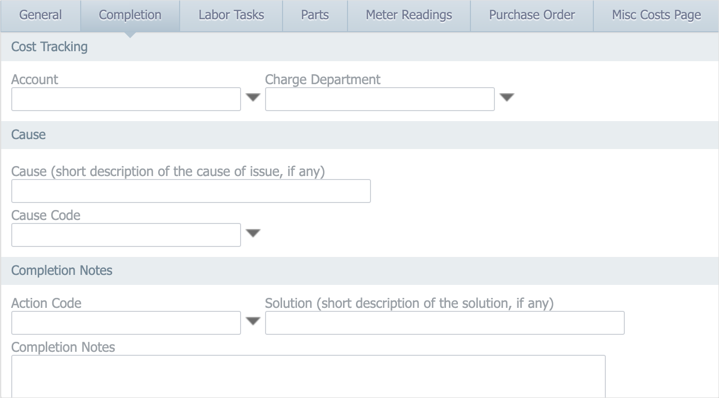
The way you record this information differs depending on which tier you’re on. If you’re on the Basic or Professional tier, you can type the problem, cause, and action information into the corresponding fields on the Completion tab:
If you’re on the Enterprise tier, you can configure standard problem, cause, and action codes that can be assigned to work orders using drop-down lists on the General and Completion tabs:
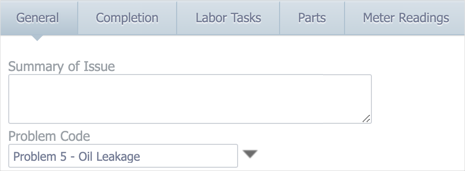
These drop-down lists ensure that entries are consistent (i.e. spelling, spacing, and terminology are standardized), and you can also configure the codes to nest, so that certain causes and actions are associated with particular problems.
To learn more about how to set up this feature (on the Enterprise tier), see Enable failure codes.
Adding the MTBF widget to your dashboard
The MTBF widget allows you to view this metric directly in your dashboard.
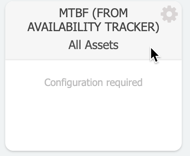
When you add the widget to your dashboard, you’ll be prompted to complete additional configuration. To do so, click the gear icon that appears when you hover your cursor over the widget:
Select the reason(s) that you want to include when calculating MTBF. These would be any reasons that represent a failure, rather than planned maintenance. You can also filter the widget by asset, category, and date to further refine the calculation:
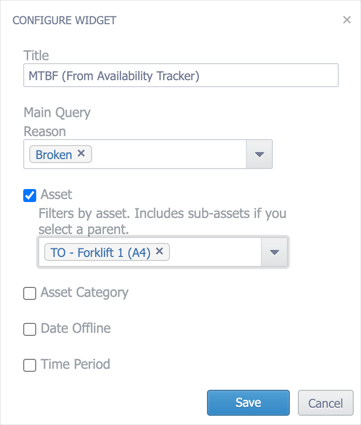
For example, you could use these filters to view the MTBF for a specific asset over the last 60 days. If you need to keep track of many assets, you can add multiple MTBF widgets to your dashboard, using the filters and titles to differentiate between them.
To learn more about Dashboards (including how to add widgets), see About dashboards.